Biological Sciences
Zebrafish Analysis Pipeline
Researchers were capturing images faster than they could annotate them. By the time manual analysis was done, the fish had woken up and any anomaly worth investigating had disappeared back into the population.
What changed
Researchers can now flag an unusual specimen and trace it back to the original dish while the fish is still available for follow-up. Automated measurement scripts replaced tedious, repetitive workflows, and a new analysis dashboard lets the team compare treatment groups and spot outliers on the fly, not days later.
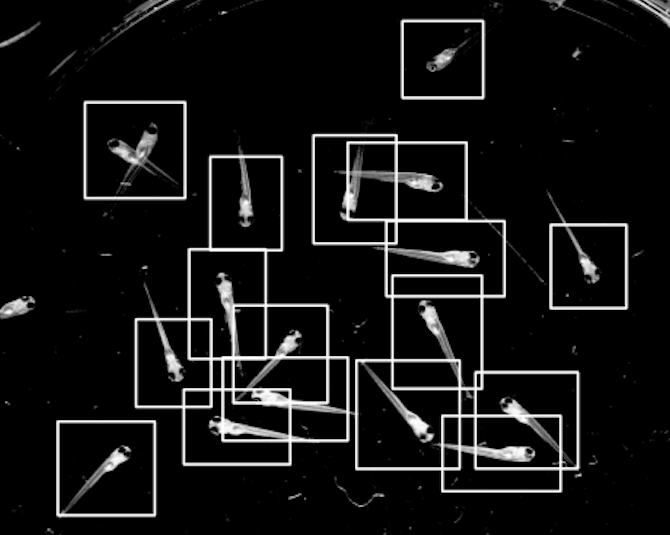
Image analysis automation
FIJI macros that iterate over a directory of microscope images, letting researchers focus on image annotation rather than tedious, repetitive workflows.
Interactive dashboard
A GUI for grouping specimens by treatment condition, running comparative and summary statistics, identifying outliers, and exporting results — all without writing code.
Designed for what's next
Phase one focused on analysis automation. The architecture supports a planned second phase: automated image segmentation and specimen identification from whole-dish captures.