AI Model Benchmark Comparison
Last modified on August 5, 2026 • 13 min read • 2,558 words“Could you write a blog post for me? It should compare the different models we have in Dartmouth Chat?” I said yes to this, excited to be the person deciding which model was the definitive best. Instead of being a couple hours of giving my own impression, it became days of research, a second write-up to explain how I reached my conclusions, and the realization that there is no singular best model.
Perhaps you’re trying to reproduce a published study with a local model. It generates an analysis with complete confidence, but the results don’t match. You adjust and try again, each attempt just as certain as the last, but your results never match. Each new answer sounds just as certain as the last, yet an hour later you’re no closer than when you started. Or you’re using a frontier, cloud-hosted model to scour a database for a correlation in your data, and just as you feel progress is within reach, you hit your token limit.
In both of these scenarios, the limiting factor comes down to choosing a model with a skillset not suited for the task at hand. So how do you judge which skills a model is suited for? What metrics should you be concerned with? And how do you ensure the data you are using for this comparison is legitimate?
Benchmark Testing
The standard for judging this kind of performance in science and industry is benchmarks. Once models are run through them, groups like Artificial Analysis , Arena.AI , and Epoch AI collect and report the results across models in a leaderboard.
Benchmarks are used to evaluate a range of skills, so each looks a little different. GPQA , which is short for Graduate-level Google-Proof Q&A, measures a model’s ability to reason through and recall scientific knowledge. It’s a set of PhD-level questions curated by experts, each multiple choice with four plausible options and a single correct answer, deliberately written so they can’t be solved with a quick web search. Scoring is simple: it is the percentage of correct answers. Below is an example of the type of questions that would be seen on the original paper :
Genetics
If a sperm from species A is injected into an egg from species B and both species have the same number of chromosomes, what would be the main cause of the resulting zygote mortality?
A) Species specific zona pellucida proteins on the egg cannot bind sperms from a different species.
B) Epistatic interactions between the genes of different species
C) Chromosomal incompatibilities will cause failure of meiosis leading to death of zygote.
D) Chromosomal recombination will not occur in different species.
SWE-Bench looks completely different. It drops a model into a real coding environment and tasks it with navigating the codebase, finding and fixing a bug, or implementing new functionality. The patch it produces is graded automatically by running the project’s tests. The model must make the previously failing tests pass while keeping the already-passing ones intact. Break something that used to work, and the task fails.
There are many more kinds of benchmarks, and different versions of each. Some are very general, testing a model over a large variety of skills, and some, like the ones mentioned previously, are more refined to singular skills.
For all their usefulness, benchmarks do have limitations. A multiple-choice format like GPQA’s is easy to grade but easy to game. A model can land on the right letter through a guess with either well-thought-out or flawed reasoning. More fundamentally, a benchmark needs a ground truth, a known correct answer to check against. That works for questions with a definitive answer, but it breaks down for qualities like creativity, writing quality, humor, and tone, which are subjective and open-ended with no single “right” answer to score against.
Benchmaxxing
A natural consequence of standardized tests is the temptation to game them. When a provider optimizes a model to score as highly as possible on benchmarks without necessarily developing the underlying skills those benchmarks are meant to measure, the measure becomes the target. This practice known as benchmaxxing defeats the purpose of benchmarks and erodes the trust we should place in any published numbers. . This is important to take into account, because with high performance comes headlines, grants, and a larger user base. These are huge incentives in this market, since all of those things bring in more money.
A well known example of benchmaxxing occurred in a version of one the benchmarks examined above: SWE-Bench Verified. This problem originated from benchmark developers using real-life examples of bugged code from rolled-back, open-source GitHub repositories that had since been fixed by human developers. The testing environment was created in a docker container, but this did not prevent the models from querying logs to find the exact commits that had been used to fix this bug. Instead of trying to find novel ways to solve these issues themselves, the models would find the code in the commit history that the human developers had used, and reimplemented that.
This great article by Jeanne Elixabeth Daniel gives several great examples of how benchmaxxing can occur, along with a few more real-life cases
How to Navigate Choosing a Model in a World of Benchmaxxing
In creating the comparison of models for Dartmouth Chat , I ran into this same problem, as well as a couple more. Each provider gets to choose what information they release and which benchmarks they run, which makes a true comparison difficult. Independent groups cannot keep up running curated benchmarks against the flurry of new models being released all the time.
For a typical user, the best approach is to focus on the benchmarks that actually match your task. If you’re writing code, a model’s scores on a coding task tells you far more than its performance on a science based benchmark. If you work across languages, look at multilingual results and knowledge base, but ignore its ability to solve complex math equations. A high overall ranking means little if it’s not measuring what you need.
It also helps to be skeptical of older benchmarks. The longer a test has been public, the more likely its questions have leaked into models’ training data, so a near-perfect score can reflect exposure to the answers rather than real skill. This points to a tension in how benchmarks are built. We want them open, so anyone can see what’s being tested and reproduce the results, but also closed, so providers can’t train against the questions. Older tests also tend to “saturate,” with every top model scoring so high the benchmark can no longer tell them apart. Newer or frequently-refreshed benchmarks are usually the better measure.
Worked Example: GPT-OSS 120B vs Gemma 4 31B
In this example, we’re going to look at the differences in coding and mathematics for two models installed locally on Dartmouth hardware: OpenAI’s GPT-OSS 120B and Google’s Gemma 4 31B. Both of these models were developed by AI industry giants, but they were released as open-weight models that anyone can download and deploy on their own hardware.
Before we even look at a leaderboard, it’s worth understanding what’s inherently different about these models just from their names. Both have a number (120 and 31) followed by a “B”, which is short for billion. It represents the number of parameters the model has, which can be thought of as the learned connections it uses to process information. As a rough rule, more parameters means more capability, but it comes with tradeoffs: responses take longer to generate, and the model’s hardware requirements and energy needs increase The two models we are investigating here are orders of magnitude smaller than commercial frontier models, so we would expect them to be not as capable as them. But how big is that gap? And is it relevant for the task we are trying to accomplish?
Let’s take a look at the actual benchmark comparisons. Throughout this example I will be using a well known leaderboard for benchmarking: BenchLM . I chose this one specifically as it has a simple user interface, and wide variety of models to choose from.
Our first step is comparing coding ability. Navigating to the webpage for BenchLM and switching from the leaderboard to the compare tab.

From here we can easily search for two models and contrast them.

The top of the page will show a ranking and overall comparison made by BenchLM, but we want to do our own investigation.

As we scroll down we can see the “Benchmark Deep Dive” section, and interacting with the coding drop-down will show multiple related benchmarks.
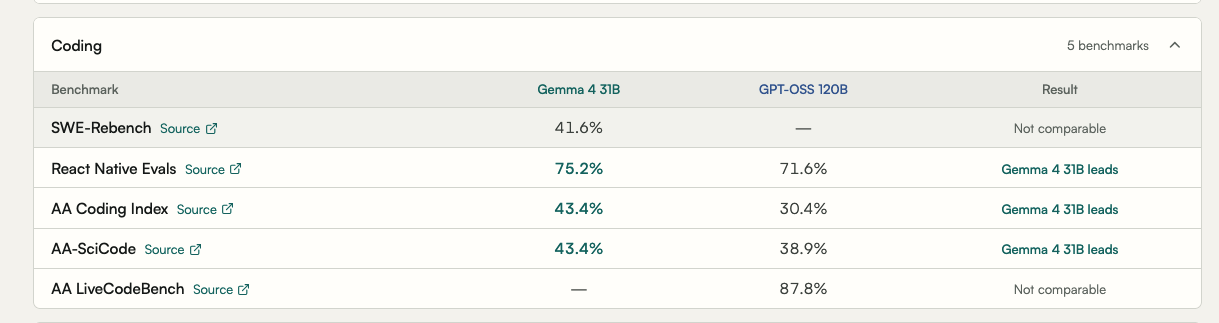
In this example we will only follow AA-SciCode, but when doing your own research, looking into each one available will give you a better overall view. I am using SciCode as an example because throughout the two years it has been around, frontier models have not surpassed a score of even 65%. This indicates that the testing material has not been distributed, nor is it being gamed with such relatively low results.
Before we look at any actual numbers, though, we should back up my claim that this benchmark isn’t being benchmaxxed. The simplest way involves checking the reported results of the test over many models. BenchLM has simplified this for us by centralizing this data. If we interact with the benchmark tab at the top of the page, we can search for AA-SciCode, and find a score table for all models that used this benchmark.
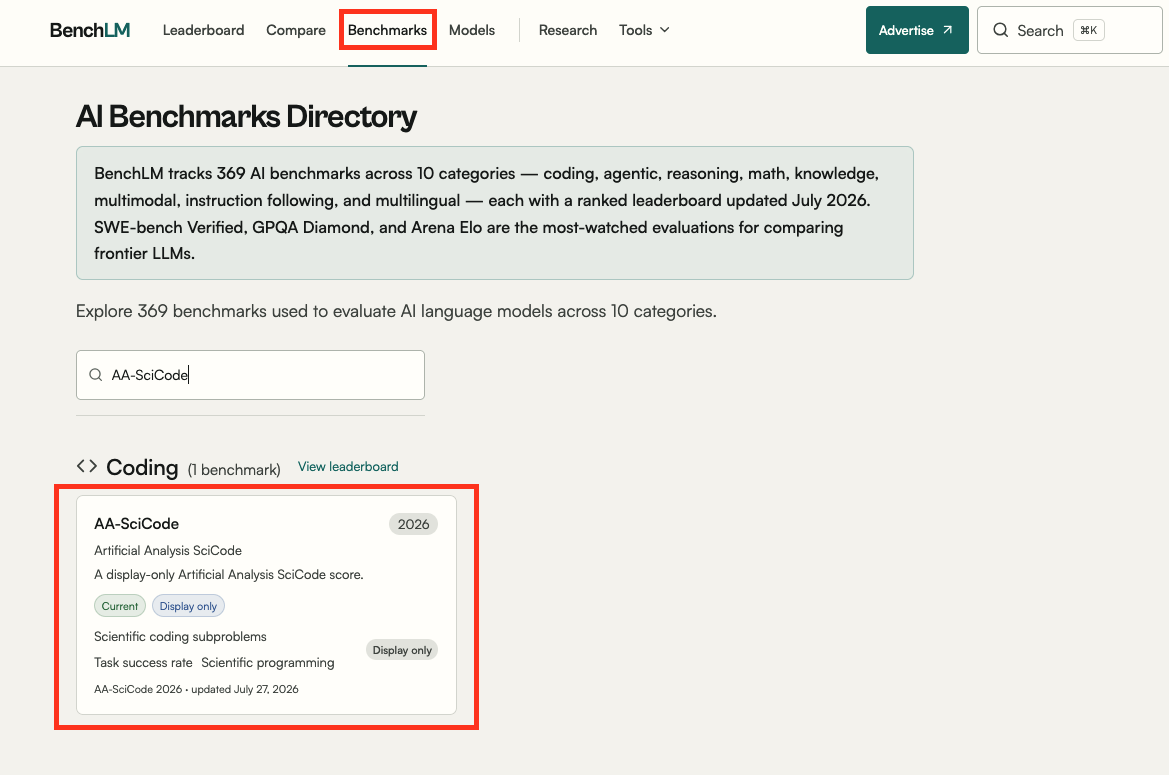
By looking at which models lead in it and confirming they are who you would expect (frontier models, or models focused on that task) then checking that the scores are spread out rather than all clustered near perfect. If you are still suspicious, search on the web for indications that the test material has been leaked.
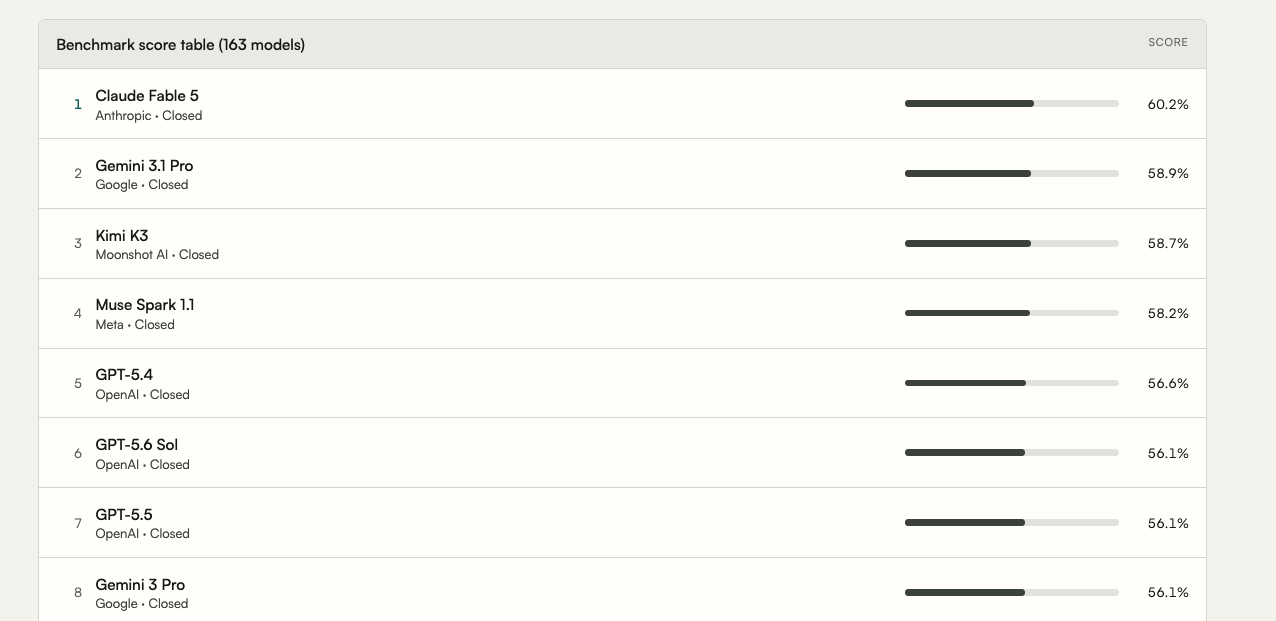
We can see that the AA-SciCode isn’t saturated by looking at the top of the leaderboard. We see that frontier models like Claude Fable 5 and Gemini 3.1 Pro are the front runners. Next we can look at the score distribution, which shows those same models only sit at about 60%, which suggests the test is still discriminating between models rather than being gamed. From there we can return to our comparison and GPT-OSS scores 38.8% and Gemma 4 scores 43.4%, a clear advantage for Gemma 4.
Following the same process across the other coding benchmarks shows a similar pattern, with the expected leaders performing well, and specialized models standing out as well. We can conclude that the benchmarks are safe as well, so seeing Gemma 4 lead in these as well give us evidence that it is the strong coding model.
The next skill we will test is mathematics, and here we run into a problem. On BenchLM there’s only a single math benchmark shown, and Gemma 4 has no data.

This is where a comparison gets tricky. If we shift our focus to the model cards ( GPT-OSS 120B , Gemma 4 31B ) , we can find some useful information.


There are three benchmarks the models have in common: AIME, MMMLU, and GPQA Diamond. We can narrow down this list by looking into the tests.
First we can see that MMMLU (Multilingual Massive Multitask Language Understanding) is a general knowledge benchmark that tests models across 14 unique languages such as Arabic, Korean, and Swahili. For our example this might be a little too broad, as well its tests skills that might not be needed. The following is an example of a prompt in the benchmark :
{
  "input": \[
    {
      "id": "e43faf14",
      "content": "أجب على سؤال الاختيار من متعدد التالي. يجب أن يكون السطر الأخير من إجابتك بالتنسيق التالي: 'ANSWER: \[LETTER\]' (بدون علامات اقتباس) حيث \[LETTER\] هو أحد الحروف A,B,C,D. فكّر خطوة بخطوة قبل الإجابة.\\n\\nأوجد درجة امتداد الحقل المحدد Q(sqrt(2)، sqrt(3)، sqrt(18)) على Q.\\n\\nA) 0\\nB) 4\\nC) 2\\nD) 6"
    }
  \],
  "choices": \[
    "0",
    "4",
    "2",
    "6"
  \],
  "target": "B",
  "id": 0,
  "group\_id": 0,
  "metadata": {
    "subject": "abstract\_algebra",
    "language": "AR\_XY"
  }
}
At first AIME looks like the better choice, since it tests mathematics directly. But there’s a catch: AIME is reissued as a brand-new exam with varying levels of difficulty every year, so a score from one year isn’t a fair comparison. Bellow is an example question seen on this test :
Problem 13
Alex divides a disc into four quadrants with two perpendicular diameters intersecting at the center of the disk. He draws 25 more line segments through the disk, drawing each segment by selecting two points at random on the perimeter of the disk in different quadrants and connecting these two points. Find the expected number of regions into which these 27 line segments divide the disk.
GPQA Diamond, is a newer version of the GPQA benchmark, which as previously mentioned is a fixed set of expert-written questions used identically across models, so even though it leans toward PhD-level science rather than pure math, it gives a cleaner apples-to-apples comparison.
I would argue this is the best benchmark to evaluate this skill from because these fields often require high level mathematics. Here is an example of the type of question used form the
benchmark
:
What is the correct answer to this question:
Two quantum states with energies E1 and E2 have a lifetime of 10^-9 sec and 10^-8 sec, respectively. We want to clearly distinguish these two energy levels. Which one of the following options could be their energy difference so that they can be clearly resolved?
Choices:
(A) 10^-8 eV
(B) 10^-9 eV
(C) 10^-4 eV
(D) 10^-11 eV
Reason through your answer step-by-step. Then, based on your reasoning, provide the single most likely answer choice. Answer in the format “The correct answer is (insert answer here).”
Looking at GPQA Diamond with no tools for either model, we see a clear difference: Gemma 4 scores 84.3%, while GPT-OSS scores 80.1% at its highest reasoning level.
So when choosing between GPT-OSS 120B and Gemma 4 31B for our defined task, Gemma 4 comes out ahead across the skills we compared. To see this difference in action, you can use Dartmouth Chat’s “add model button.” This would allow you to give both models the same prompt and see the difference in results, giving you a simpler way to compare.
To Wrap-up
Deciding which model is best has become a lot like deciding what is the best meal, it’s never that black and white. Instead, the goal is to find the model best suited to help you in a particular setting, for a specific task. Benchmarks are the best tool we have for that, as long as you read them carefully, match the benchmark to the work you actually do, make sure the test isn’t being gamed, and compare models on the same terms. Beyond all that, when the numbers run out, the most reliable benchmark is still your own work: narrow the field to a few strong options, then test them on the task in front of you.
If you would like to talk to an expert about which models could be right for you work, you can reach out to research.computing@dartmouth.edu .